Stony Brook Storm Surge Research Group
How to Use this Site
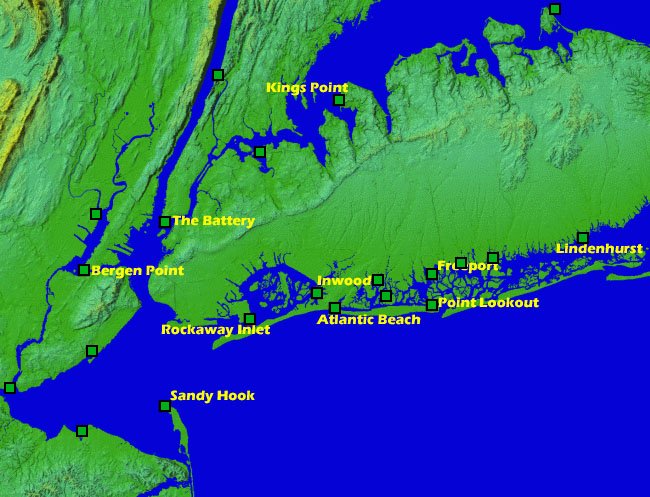
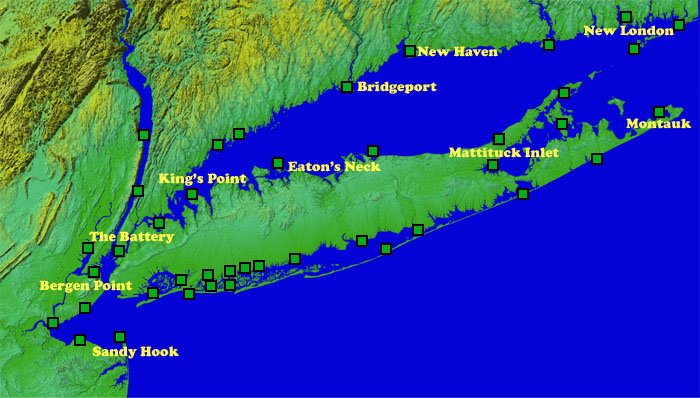
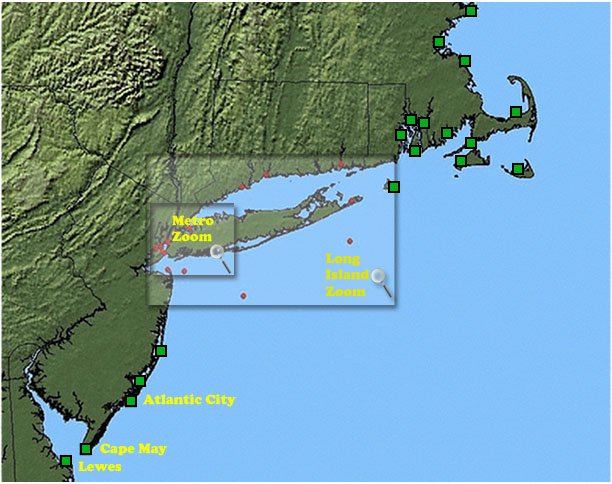
A set of small colored squares is attached to each tidal station on all three map scales (Metro New York, Regional, Eastern Seaboard), which change color on the basis of model-predicted storm surge elevations expected within the next 48 hours, if any.
Normally colored green, a square will turn to yellow if the surge is predicted to rise 30 cm (1 ft) above normal*, and will turn to red if the surge is expected to rise 60 cm (2 ft) above normal*. Clicking on the square takes the viewer to a table presenting the predicted height of the surge for each listed station and when it is expected to occur. As with all ocean and atmospheric predictions, there are uncertainties associated with predictions; standard deviations are also listed, based on running a suite of models (typically 9 or 10) with somewhat differing initial conditions and physics.

| Fig. 1: NOAA Battery NY tidal records for a typical month, illustrating spring and neap tides and their relation to the phase of the moon. Water levels are shown relative to Mean Lower Low Water (MLLW). Also shown are the mean high water (MHW) and mean low water (MLW) datums. |
*Note: The Stony Brook Storm Surge Research Group uses the mean higher-high water (MHHW) benchmark as the local "normal" high tide, which is based on the long term (18.6 yr) mean of the higher of the two semi-diurnal (twice-daily) high tides, neglecting the lower of the two daily high tides. Known as the diurnal inequality this daily variation in the height of high tide is due to the inclination of the Moon's orbit (28.5 deg.) with respect to the equatorial plane of the earth. Using the MHHW datum gives a better benchmark for triggering off alert signals than using say MHW.
Current Moon Phase

Disclaimer: This is a research product still under development and should never be used for emergency management decisions relating to protection of life or property under any circumstances.


